⚡ Project data in. Board-ready timelines out.

Turn project data into
Plan-on-a-Page
timelines.

Import Excel or CSV exports from MS Project, Jira, Smartsheet, Monday.com and other planning tools. PoapFlow converts them into polished executive timelines with swimlanes, milestones, baselines, themes and annotations.

Windows desktop app
Works offline after install
7-day money-back
Plan data stays local
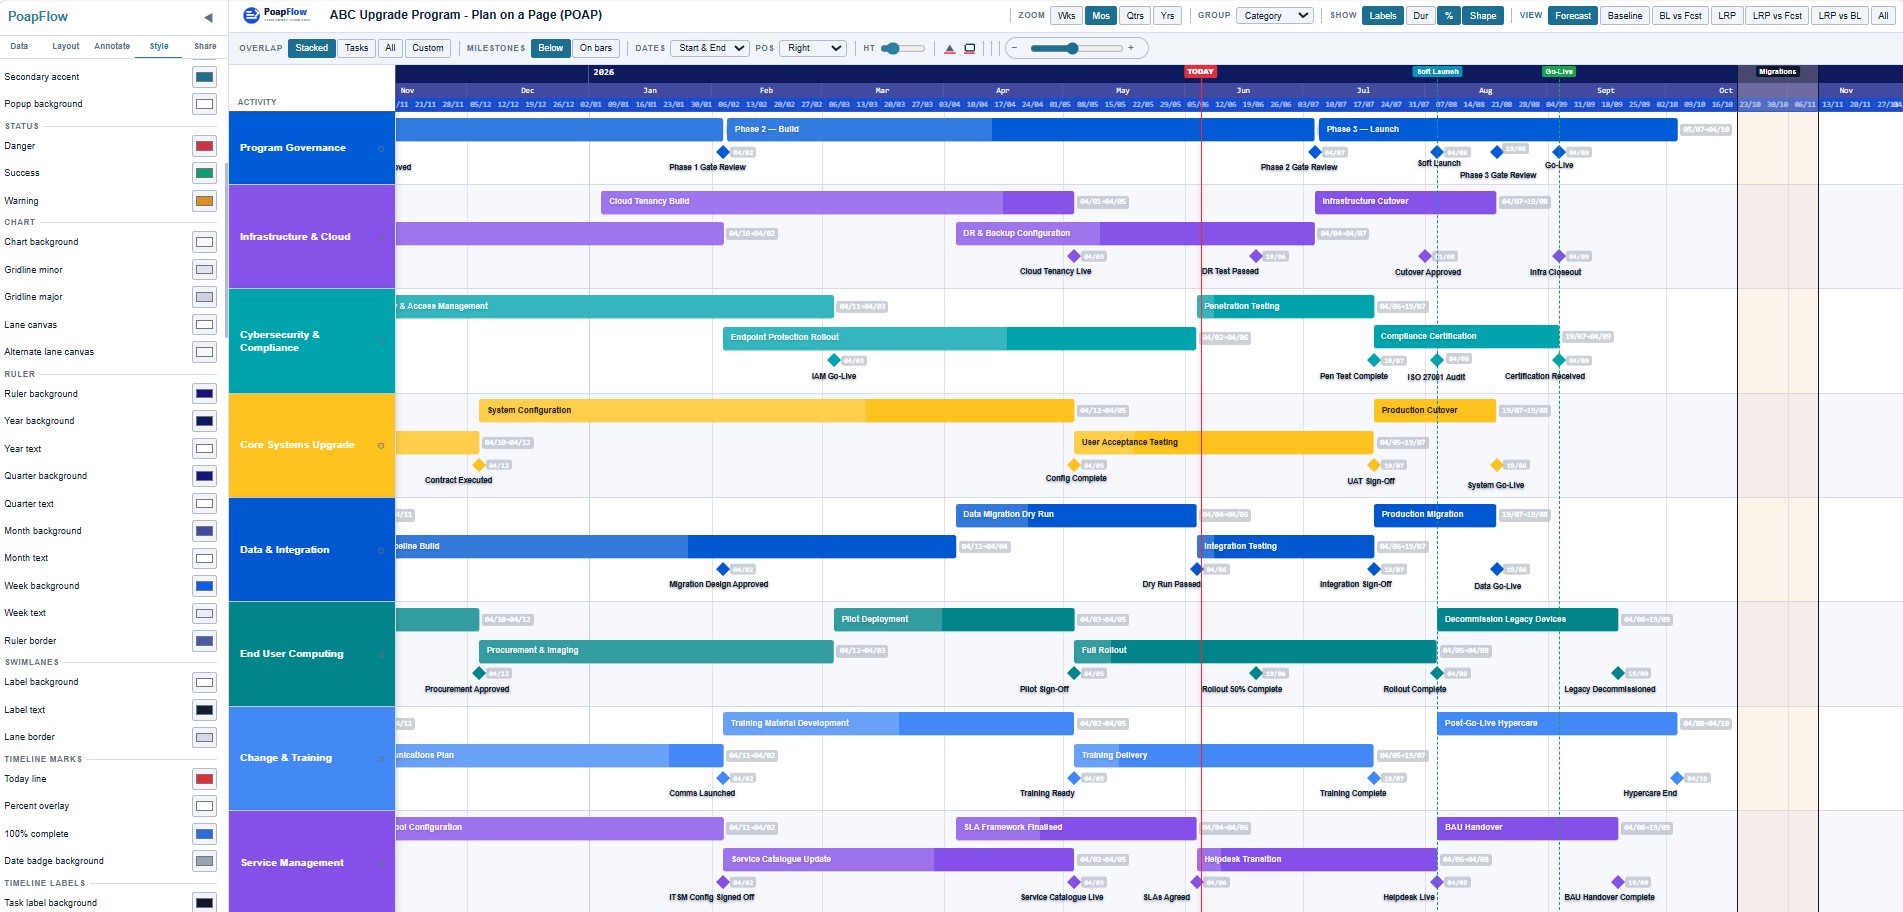
PoapFlow sample Plan-on-a-Page timeline with swimlanes, milestones and grouped project data Click to enlarge

Imports data from your existing tools

Microsoft Project Excel / CSV Jira Smartsheet Monday.com ServiceNow Oracle Primavera Any CSV export

What PoapFlow does

From project-tool export to executive timeline

Your source data can stay in MS Project, Jira, Smartsheet, Monday.com or Excel. PoapFlow takes the exported spreadsheet and turns it into a clean Plan-on-a-Page view your steering committee can understand quickly.

Excel / CSV export
Task
Start
End
Group
Data Centre Decommission
01/10
01/02
Infrastructure
Security Baseline
01/08
01/10
Cybersecurity
System Configuration
01/12
01/05
Core Systems
Phase Gate Review
01/07
01/07
Governance
User Acceptance Testing
01/05
16/07
Core Systems

Import planning data from the tools your teams already use. Map columns once, then refresh without rebuilding your presentation from scratch.

Plan-on-a-Page output
JanFebMarApr
Programme Phase
Infrastructure Cutover
UAT & Readiness

Create board-ready swimlanes, milestones, baselines, highlight lanes and branded themes without leaving the desktop app.

Sound familiar?

Project tools manage the work.
They rarely create the executive story.

MS Project, Jira, Monday, Smartsheet and Excel are excellent sources of planning data. But their exports still need heavy manual work before they become a clean one-page timeline for steering committees and leadership packs.

Can't refresh without losing your layout. Reimporting data wipes all your custom formatting and annotations.

No programme-level overlay. Can't add summary bars, gates or custom milestones above your imported project data.

Baseline vs forecast is impossible. No tool shows what slipped vs the original plan without a manual workaround.

Shapes and colours are locked. You can't match your organisation's brand without exporting to PowerPoint.

No drawing tools. You export to PowerPoint just to add a dependency arrow or a risk callout.

Cloud tools can be hard to approve. Sensitive project data may need to stay local, and corporate environments often require IT-controlled desktop deployment.

Features

Everything you need to present plans
that get decisions made.

Built for the people who present plans to boards, steering committees and executive leadership — not just for project administrators.

Unique 📥

Import from any planning tool

Import Excel or CSV from MS Project, Jira, Smartsheet, Monday and more. Refresh schedules without losing your layout, formatting or annotations.

Unique 📊

Baseline, forecast & variance

Show what slipped vs the original plan in one clear view — ghost bars, connector lines and variance day labels. Instantly visible to any executive.

Unique 🏊

Portfolio & programme swimlanes

Create portfolio, program, project, release and workstream swimlanes. Add custom milestones and summary bars not in any project file.

🎨

Full format bar

Customise colours, shapes, fonts, borders and opacity for every bar and milestone. 12 built-in themes plus save your own.

✏️

Draw dependencies & callouts

Draw critical paths, dependency arrows, risk callouts and narrative annotations directly on the chart. No PowerPoint export needed.

🔄

Drag-and-drop editing

Move multiple tasks and milestones with simple drag-and-drop. Add custom milestones, tasks, decisions and risk flags anywhere.

🌐

Publish as interactive HTML

Publish plans as a standalone HTML file for easy stakeholder sharing. Includes freeze panes, view toggles and a searchable data panel.

🔒

Desktop app for corporate use

Install PoapFlow on Windows, then work offline without uploading plan data. IT can deploy it through standard corporate software processes.

♻️

Reuse styles across plans

Save custom themes and reuse them across multiple plans and reports. Maintain consistent branding across your entire programme.
Who it's for

Built for people who present plans to leadership

🗂

Portfolio Manager

Overlay programme gates and strategic milestones across multiple projects in one chart.

📋

Programme Manager

Show what slipped, what's at risk and what's on track — variance highlighted automatically.

Project Manager

Add custom milestones for SteerCo dates and dependency callouts your project tool can't generate.

🚀

Delivery Manager

Keep leadership informed with board-ready plans that update in minutes, not hours.

📅

Master Scheduler

Full ruler control to week level. Custom task naming, flexible swimlane creation and baseline vs forecast in one view.

🏛

PMO Analyst

Standardise plan-on-a-page reporting across your entire portfolio with reusable templates.

How it works

Board-ready in 3 steps

1

Import your data

Export Excel or CSV from MS Project, Jira, Smartsheet, Monday.com or your planning tool. Drop it into PoapFlow.

2

Build your narrative

Add swimlanes, milestones, callouts, highlight lanes and baseline overlays. Style the plan to match your brand.

3

Share & present

Present, publish or share the finished timeline. Refresh data later without losing your formatting work.

Why PoapFlow

How PoapFlow compares

Feature PoapFlow MS Project Jira Monday Smartsheet
Baseline vs forecast overlay✓ Yes◐ Basic
Programme-level custom swimlanes✓ Yes
Refresh data without losing layout✓ Yes
Draw arrows, callouts, annotations✓ Yes
Full format bar (colour, shape, font)✓ Yes
Runs offline after installation✓ Yes
Publish interactive HTML for stakeholders✓ Yes

Testimonials

From people who present to executives every week

★★★★★
"I've used every tool on the market. PoapFlow is the first where I can build the narrative I need — not just a data dump. The baseline overlay feature is exactly what portfolio managers have needed for years."
JT
James T.
Portfolio Manager · Melbourne
★★★★★
"The format bar and variance highlighting are worth the price alone. I show leadership exactly what slipped against the original plan without building a separate comparison slide in PowerPoint."
SM
Sarah M.
Master Scheduler · Sydney
★★★★★
"Replaced a $99/month SaaS subscription. Once installed by IT, it runs offline and keeps our schedule data local. The week ruler in dd/mm with end-date display is exactly how we report to our steering committee."
DR
David R.
Programme Manager · Canberra

Pricing

One professional plan. Everything included.

Built for programme managers, PMOs and delivery teams who need polished Plan-on-a-Page timelines from project-tool exports.

All prices in AUD · GST may apply · 7-day money-back guarantee · Need multiple users or corporate deployment? Contact us for enterprise licensing.

Not ready to buy? Try PoapFlow free for 7 days — no account, no credit card.

Request Free Trial →

Windows desktop app · Works offline · Full features for 7 days

Enterprise & Government

Built for corporate Windows environments

PoapFlow is a Windows desktop app that can be installed or deployed by IT, then used offline without uploading sensitive plan data to a cloud tool.

Windows desktop installer Offline-first planning workflow Offline licence activation Can be deployed by IT No data leaves the device No account or login required Volume licence agreements available Dedicated onboarding support
Contact Enterprise Sales →

Turn the export you already have
into the timeline leadership needs.

Import from MS Project, Jira, Smartsheet, Monday.com or Excel and build a polished Plan-on-a-Page view without rebuilding it in PowerPoint.

Start Free Trial → Buy Professional — $1,299 AUD